Runoffs and the Collapse of Voter Turnout

Gary A. Keith

It is runoff primary election time—so by all means, get out there and vote!

For those of us who follow the health of democratic cultures, institutions, and practices, though, runoff elections give us ulcers. A chief reason? You DON’T vote!! Turnout is abysmal. So, to repeat—by all means, get out there and vote.

Runoff elections, though, are arguably one of the least democratic procedures if we value universal participation as essential to democratic representation and governance.

Granted, these March and May primaries are not the general election—but they are the vehicles that narrow the choices for November. And, in reality, given one-party dominance in district after district in Texas (or even statewide), the result of the primary nomination battle determines who wins office in November. So, valuing high-level participation in democratic affairs, we would want high turnout in these primary and primary runoff elections.

Instead, we get weak participation in primaries, and then in runoffs—just a trickle. Why do we even have runoffs? Only 9 states have them. In the other 41, whichever candidate wins the most votes in a primary wins the nomination—just as we do in a general election. In 2006, Rick Perry won the gubernatorial general election with 39.0% of the vote. No runoff is mandated for the general election; if there are more than two serious candidates, it is possible for one to win with less than a majority, just as happened then with Perry. Why, then, do we have them for primary elections? The answer is not clear, as we have long had them. But it is noteworthy that nearly all the states that require them are southern states (where turnout is already lower than in other states)—and there is some evidence that they were initiated a century ago to ensure that Anglos would be the nominees, fearing that multiple Anglo candidates would split the Anglo vote and allow a single African-American candidate to win the nomination with a plurality of the vote.

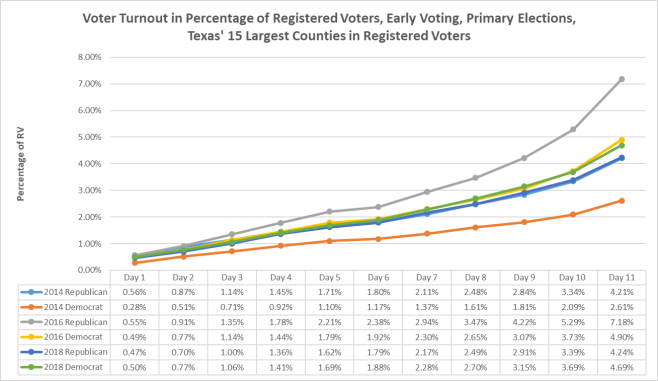
We can predict that in these May runoff primaries there will be a turnout of less than 10 percent, by whichever metric is used to calculate it (see below). Table 1 has the turnout for the March 2018 primary, then the primary turnout for 2014 and 2016 as well as the runoff turnouts in those two previous elections.

TABLE 1        Voter Turnout in Texas primaries 2014, 2016, 2018

  Voting Age Population (VAP) Registered Republican Turnout Democratic Turnout Republican Runoff Turnout Democratic Runoff Turnout
2018 19,900,980 15,249,541 1,549,573 (10.2% VAP/ 7.8% reg.) 1,068,463 (7.0% VAP/

5.4% reg.)

? ?
2016 19,307,355 14,238,436 2,836,488 (19.9% VAP/ 14.7% reg.) 1,435,895 (10.1% VAP/ 7.4% reg.) 376,387 (2.6% VAP/ 2.0% reg.) 186,912 (1.3% VAP/ 1.0% reg.)
2014 18,915,297 13,601,324 1,358,074 (10.0% VAP/ 7.2% reg.) 560,033 (4.1% VAP/ 3.0% reg.) 752,780 (5.5% VAP/ 4.0% reg.) 201,283 (1.5% VAP/ 1.1% reg.)
SOURCE: Texas Secretary of State Turnout and Voter Registration Figures. www.sos.state.tx.us/elections/historical/70-92.shtml

We can measure voter turnout using one of three metrics: (1) by looking at the voting age population (VAP)—i.e., everyone over 18; (2) by looking at the voting eligible population or VEP (VAP minus those ineligible to vote for lack of citizenship, felon status, etc.); or (3) by looking at those that chose to register to vote. The Secretary of State (SOS) does not have VEP data. So, in using SOS data to examine voter turnout, we can either look at the percent of the voting age population that voted or at the percent of registered voters who voted. For this blog post, we do not need to get into the arguments for one or the other metric. All we need to do is to note the low percentages—and the drop-off from primary to runoff—in either of the metrics.

In the last gubernatorial election year (2014), combining all who voted in either the Republican primary or the Democratic primary, 1.9 million Texans voted. When the runoff was held some weeks later for those races where it was required, just under one million voted, or a drop-off of about 50%.

In the last election, 2016 (a presidential election when voting is always somewhat higher), combining all who voted in either primary, 4.3 million Texans voted. When the runoff was held, just over half a million voted, for a drop-off of nearly 90%.

Some drop-off in runoffs is understandable, as many areas of the state will not have local or regional runoff races (as all those races ended with a majority victor). But in many years there are some statewide runoffs—as in this year’s Democratic gubernatorial race—combined with some local and district runoffs, so every voting district in the state has a runoff ballot.

In the 2018 primaries, a total of 2.6 million Texans voted in the two parties’ primaries. In the runoff elections we are now engaged in, given the 2014 and 2016 data (and that data is consistent with earlier elections, too), there may be something around 1 million Texans who vote and make the final choice of candidates for Governor and for some Congressional, state legislative, and other runoff races. One million out of 20 million in the voting age population. One million out of 15 million who are registered to vote.

There are always unique reasons for turnout in any given election year—candidate quality, campaign spending, media attention, etc. But each time, Texas turnout is low compared to other states (see “Voter Turnout,” www.electproject.org/home/voter-turnout/voter-turnout-data ), and the runoff turnout is even smaller than the small original turnout.

So what?

Again, the lower the turnout, the less the political system meets an essential requirement of a healthy democracy—universal or nearly universal participation. The lower the participation, the easier it is for organized and motivated groups to win control of government, even if not representative of the broad populace. The greater the public disconnect with government.

Texas could redress that deficiency by doing one of two things:

  • Abolish the requirement for a runoff election and determine primary nominations just as 41 other states do—the candidate with the highest vote in the primary (with its higher turnout than in a runoff) wins the nomination. Or in other words, use the same counting requirement for the primary that we use for the general election. If a plurality is good enough in November, when it actually counts, why is it not good enough for the earlier primary elections?
  • If we are determined to keep a majority requirement for a nomination, change to a different election system that selects a majority candidate without the requirement of a later low-turnout, expensive runoff election.

There are several viable systems for amassing a majority other than a runoff election. They go by different names, with somewhat subtle differences in the mechanics of each. Some of them are:

  • Instant Runoff Voting (IRV)
  • Ranked Choice Voting
  • Range Voting
  • Approval Voting

Each of those systems produces a majority victor without the time, expense, and low turnout of the Texas runoff system—and thus comes closer to the democratic ideal of higher (or near universal) participation. Generically speaking, the voter ranks candidates rather than simply selecting one candidate. Then, if no candidate receives a majority of the Number One votes, the votes for Number Two are counted, and perhaps then for Number Three, and added in until a candidate achieves a majority. This happens with pen and paper or computer—rather than another month-long campaign with its expense and the inevitable low turnout in a runoff. The race is determined by the turnout on primary date.

The Center for Voting and Democracy (see www.fairvote.org ) is the biggest advocate for IRV. It notes that more than 2 million voters live in IRV systems now—in places such as Memphis, Oakland, Minneapolis, and now Maine. It is used by five states for their overseas balloting, and it is used in many student elections and corporate board elections.

IRV can minimize the dynamic of the “wasted vote.” The counter is that it would hurt the spoiler candidate’s chances, in favor of the incumbent. Another criticism of the alternative systems is that they can be confusing to voters, who are used to simpler counting systems.

But if we get rid of runoffs—by either simply not requiring them or by using a different system for achieving the majority—then perhaps we could refocus our energies on the issues of improving our primary and general election turnout and seeking other means of tending to the health of our democracy.

Now go vote.

Dialing for Dollars: Less Often Maybe

By Stefan Haag

Among the nine recommendations by the 2018 Charter Review Commission is a proposal for public funding for council and mayoral candidates. The basics of the recommendation, which passed by a 7 to 3 vote, are:

The CRC recommends amending the Charter to establish a Democracy Dollars Program to provide eligible Austin residents up to four (4) $25 Democracy Dollar Vouchers (“Democracy Dollars”) per election cycle. The Democracy Dollars may be donated to a resident’s district city council or mayoral candidate.

The purpose of the Democracy Dollars program is to ensure that all people of Austin have equal opportunity to participate in political campaigns and are heard by candidates, to strengthen democracy, to fulfill the purposes of single-member districts, to enhance candidate competition, and prevent corruption.

In making its recommendation, the Working Group considered six major goals of a model campaign finance system for Austin:

  1. the 10-1 single-member district system’s goal of fair representation is enhanced, and not undermined by, the campaign finance system;
  2. Austinites across the city have faith that our City’s democratic process is not corrupted by the monied interests, thwarting the majority’s will. The Independent Ethics Commission is more thoroughly addressed beginning on page [14] as “Recommendation No. 2.”
  3. city candidates can run with funds primarily from their district’s constituents without having to raise the vast majority of their funds from outside their district;
  4. city candidates can spend time with and listen to their constituents in their district and thereby respond more effectively to policy needs impacting their district and ultimately the City as a whole;
  5. at least several candidates in each race are competitive financially so that voters have choices and issues are aired; and
  6. the city’s campaign finance and ethics laws are effectively and fairly enforced so that the laws are followed, violators are investigated and punished, and the public has confidence in the system’s integrity.

After evaluation of the key facts and concerns with Austin’s current campaign finance system, and considering several potential solutions, the Working Group ultimately concluded that adding a public voucher component to Austin’s current campaign finance system was the best solution. The Working Group recommended that the CRC look to the Seattle Democracy Voucher program as a starting point for designing Austin’s program.

The Democracy Dollars program is based on Seattle’s program, which has conducted only one election under the system. There have been several studies on the program and its effects on the one election in which it was utilized. The best study supporting the program makes the following points:

Launched in the 2017 election, the Democracy Voucher initiative successfully increased the number of residents participating in the campaign finance system. In total, 20,727 residents in Seattle returned their vouchers – more than twice the number that made a cash contribution to a local political candidate. About four percent of Seattle residents participated in the program. While the Democracy Voucher initiative increased participation in the campaign finance system, some groups of Seattle residents were more likely to return their vouchers than others. Wealthy, white and older residents were more likely to participate in the program than low-income, younger and non-white residents. Individuals who were already politically engaged, as measured by previous voting behavior, were more likely to return their vouchers than registered voters who rarely voted in elections. These differential rates of return by race, income, age and political engagement create opportunities for program improvements in 2019.

On the other side of the issue is an article from the Texas Monitor, which makes the following points:

Months before the vote, the Seattle Times editorial board recognized what might happen. “The vouchers give well-organized candidates, especially incumbents, an advantage. Some members of activist organizations are giddy at the prospect of swooping up as many vouchers as early as possible.”

The ballot issue itself was an example of the editorial board’s worry. Advocates, many of them national opponents of Citizens United, like Common Cause, helped raise nearly $1.4 million to get out the vote. Opponents raised a little more than $46,000.

The Pacific Legal Foundation in Bellevue, across Lake Washington from Seattle, is challenging the Democracy Voucher program on Constitutional grounds that it forces property owners to support candidates — and political speech — they might not agree with.

Ethan Blevins, the Foundation attorney carrying the case, told The Texas Monitor that Elster v. City of Seattle has added a second complaint that addresses those who live outside the city and are thereby ineligible to take part in the voucher program.

A superior court judge dismissed the lawsuit in November, but Blevins said he is appealing and will continue to appeal the case to the Supreme Court, if necessary.

“There is a fundamental idea here. The Supreme Court has made clear the government can’t force you to support speech you oppose,” Blevins said. “The point that gets overlooked when they say this is no different than any other campaign finance plan is the property tax. It’s compelled speech, a clear violation of speech rights.”

The three members of the CRC that voted against the proposal are Matt Hersh, Jeff Smith, and Roger Borgelt. Jeff Smith explained his vote in a personal email to me:

My “No” vote has nothing to do with the principle of public financing of campaigns; I’m all for that.  Instead, I opposed moving this particular plan to the council, and possibly the voters, because it’s just not ready.  As you know, the Democracy Dollars proposal is modeled on the Seattle version – a bold experiment that has survived exactly one test and produced no verifiable evidence of the many beneficial results attributed to it by its enthusiasts.  I’m glad that Seattle took the plunge, but they are operating in a different environment.  If Austin is going to take a similar leap, it should at least be vetted by the public beforehand.

There are a thousand moving parts to the Democracy Dollars program:  Who qualifies for funding?  How much funding?  Who gets the vouchers?  How much are the vouchers worth?  What are the rules regarding collecting and spending the public funds?  What about bundling?  Where does the money come from?  When and how are the vouchers distributed?  What are the spending limits?  The list goes on and on.  And there are unintended consequences.  For example, I would expect to immediately see the rise of voucher harvesters – third parties who “collect” funds for a piece of the action.  How do we regulate them?

Public financing does nothing to stem the influence of third-party, dark money organizations in local elections.  As those become more active, we may have to have an open-ended stream of public money to offset their influence, or we may have to be satisfied to just give a wider range of candidates a running start and not guarantee their competitiveness through the election.

All of these issues, and many more, deserve a serious hearing before the public.  Instead, we have a plan that only a handful of people are even aware of today, which is proposed to be appended to a very long ballot in just a few months.  If this plan gets by the council, it will surely fail in November.  It is too easy to argue that taxpayers are being asked to fund campaigns for people they may or may not agree with – people they may not even be able to vote for.  I can’t recall exactly how many times we voted on single-member districts before that came to pass, but I do remember that it was on the ballot in 1984.  If this goes down in 2018, it will be several years before there is an appetite to revisit it, so we should at least take our best shot and take the time to build public buy-in.  And, of course, if it should pass in November, the legislature will void it and probably ensure that no public funding scheme can occur in Texas.

So, for me, it’s not a question of the status quo versus “fairness”.  I concede that money, and thus wealth, plays an outsized in our elections, but I don’t think we should jump to change the system without thinking it through.

In response to a request from me, Matt Hersh provided the following reason for his vote against the Democracy Dollars program:

I have two main concerns about the Democracy Dollars Program.  First, it mandates in the charter that 1.5 million dollars will come out of the general revenue every year.  I feel like this is a dangerous step to take when we are under the threat of losing tax revenues by the legislature.  And even if the legislature does not act on our ability to generate revenues, the charter amendment still mandates the money come out of the general revenues with the Council having no flexibility. This provides the very real potential for the Council being forced to cut social services to fund the program.

Second, I believe that any public funding mechanism should give all qualifying candidates equal funding.  That is kind of the point of public funding.  In a situation where voters are given the vouchers and then choose which candidates to contribute to, it places a huge advantage on incumbents or anyone with established name id.

Most non-incumbents have little to no name id.  So how are they going to convince voters who have no idea who they are to give them their vouchers?  To convince 10’s of thousands of voters to donate their vouchers to you would require a campaign which requires money.  As such, the candidates would be forced to run a campaign to convince voters to donate to them their vouchers in the same fashion they would run a campaign to convince voters to vote for them and nothing has changed or improved.

It is also naive to think candidates would have success going door to door to raise money.  It requires money to communicate to 10’s of thousands of voters.  Most candidates would love to go door to door instead of raising money but one simply cannot reach enough people that way.

I also disagree with the notion the incumbents have been reliant on wealthy donors.  I know it is easy to say and people envision the worse, but the reality is that we do have a $350 contribution limit.  This is not a dynamic where the Koch brothers or someone comparable are contributing 100’s of thousands of dollars or even 10’s of thousands of dollars.  A current problem in campaigns is that some industries have been able to generate influence by their ability to bundle.  I believe the voucher system would make that worse.

So the question becomes, does the public financing system used by Seattle and proposed for Austin offer benefits that are eclipsed by the costs, in terms of possible consequences such as those mentioned by Jeff Smith and Matt Hersh? That question should be answered by the residents of Austin but only after the issue has been discussed fully in a series of citizen forums.

GSD: Get Sh*t Done

There’s a group in Southwest Austin that I’ve mentioned before. Their motto is GSD, and they do. Their officers are Carrie Collier-Brown, president; Margaret Chen Kercher, vice president; Michelle Moon Reinhardt, communications; Monica de Leon, membership chair; Erika Nowlin, secretary; Cindy Whitesides, treasurer; Lynn Kurth, grassroots organizing chair, and David Holmes, parliamentarian. The membership is motivated and engaged. Consequently, the group is super organized and, as this post demonstrates, very effective in accomplishing their goals.

They have organized 17 precincts in Southwest Travis County, Texas. For the primary election in March, they conducted phone banks, wrote personalized, hand-written postcards to potential Democratic primary voters, recruited and trained block walkers, facilitated training for Volunteer Deputy Registrars (VDRs), used social media to connect with members and to recruit members, and held meetings that included Democratic Party primary candidates.

The following is an assessment of their accomplishments, most of which I presented at the May 6 meeting of the group. The remarkable increase in participation in the Democratic Party primary election in the 17 precincts is displayed in the chart, which compares the voter turnout rates in the precincts in 2014, 2016, and 2018.

Chart of 17 Precincts

In the Democratic Party primary in Travis County, the average (mean) voter turnout was 15.61 percent of registered voters. Comparing the voter turnout results in the 17 precincts with the results in all 247 Travis County precincts illustrates the effects of the group’s efforts. The table shows the rank of the 17 precincts among the 247 precincts, the percentage of the vote cast during early voting, the percentage of the vote cast on Election Day, and the percentage voter turnout:

Rank Precinct Percentage of Vote that was Early Vote Percentage of Vote that was on Election Day Percentage Voter Turnout
37 362 60.71% 39.29% 23.04%
38 339 57.60% 42.40% 22.90%
44 354 62.95% 37.05% 22.10%
49 363 56.36% 43.64% 21.32%
52 301 49.65% 50.35% 21.19%
59 366 59.57% 40.43% 20.48%
61 352 61.79% 38.21% 20.11%
66 358 60.91% 39.09% 19.74%
76 302 65.10% 34.90% 18.84%
82 304 61.48% 38.52% 18.04%
83 303 58.60% 41.40% 18.02%
88 360 59.53% 40.47% 17.74%
97 349 60.02% 39.98% 17.38%
116 367 54.52% 45.48% 15.69%
128 351 58.36% 41.64% 14.93%
132 361 55.87% 44.13% 14.60%
138 365 51.87% 48.13% 13.95%

Fourteen of the 17 precincts (82%) were above the average for Travis County’s precincts in voter turnout. The three precincts that were below the average were within 1.66 percentage points of the average.

The improvement in voter turnout by the 17 precincts from the last gubernatorial primary election in 2014 was also remarkable, with some precincts nearly matching the voter turnout garnered in the last presidential primary in 2016. The table ranks the precincts in terms of difference in voter turnout percentage between 2014 to 2018:

Precinct 2018-2014
366 13.09%
339 12.43%
362 12.27%
363 11.90%
301 11.81%
303 11.68%
354 11.47%
360 11.47%
352 11.29%
304 11.29%
349 10.53%
367 10.32%
358 10.31%
351 11.10%
361 9.86%
365 9.21%
302 5.48%


The average voter turnout by precincts in Travis County increased between 2014 to 2018. The voter turnout increased from an average of 7.58 percent in 2014 to an average of 15.61 percent in 2018–an increase of 8.03 percent in voter turnout. Sixteen of the 17 precincts increased by more than the average precincts’ increase.

Early voting also increased and the relationship between the percentage of early voting and total voter turnout also increased. The graphs show the percentage of the vote cast during early voting and the percentage voter turnout for the 17 precincts in 2014 and 2018:

2014 Early Vote and Voter Turnout

The relationship is sporadic in 2014. The Pearson correlation is r=0.26, which is positive but not strong.

2018 Early Vote and Voter Turnout

The relationship is more tightly grouped in 2018. The Pearson correlation is 0.36, which is positive and stronger than in 2014.

Employing the methods used by Blue Action Democrats, other groups in counties in Texas could increase voter turnout rather dramatically. A group of dedicated people, organizing their geographic area, and employing similar tactics can create civic engagement.

Disclosure: I am a member of the group, which could affect my assessment of the group’s accomplishments. However, I believe that the data tell the unbiased story.

Democratic Party Runoff in CD 25: Who’s the Better Candidate?

by Stefan Haag

I’m a resident of Congressional District (CD) 25, a seat that is currently held by Republican Roger Williams. Williams refuses to hold open town halls in Travis County, where a large number of his constituents live. In fact, the portion of Travis County that is in CD 25 is 34.57 percent of the district’s total population. But Travis County does not vote for Williams. So his refusal is understandable based on his political calculations.

There are two Democratic candidates vying in the May 22, 2018 runoff to face Williams in the general election in November. I’ve visited both candidates’ Web sites, looked at their positions on the issues that are most important to me, and thought strategically about which candidate should receive my vote. There are many considerations: issue positions of the candidates, experience of the candidates, ability to connect with voters, and political context for the contest. I consider each of these factors in turn. But, for me, the most important factor is which candidate is more likely to defeat Williams in the general election in November.

First, the issue positions of the candidates are very similar. In fact, I would support either candidate over Williams, regardless of who wins the runoff election. Second, the candidates’ experience is quite different. Perri is a defense attorney, and I’m certain, has the support of the Texas Trial Lawyers Association, which can provide a considerable number of dollars. Oliver is Division Controller for St. David’s Healthcare which provides health care in central Texas. She is also a recent appointee to the Central Health Board of Managers, the group that oversees the hospital district that provides care to low-income residents in Travis County. She also volunteers for Meals on Wheels. She has a law degree as well. If votes in the Democratic Primary on March 6, 2018 indicates an ability to connect with voters (my third consideration), then the results, especially in the rural counties of the district favor Oliver. Here’s a comparison of their vote totals, and the percentage of the total vote for the two candidates in each county.

County

County’s Contribution

2018 Primary Vote Oliver

2018 Primary Vote Perri

Total Vote Oliver and Perri

Percentage of Vote for Oliver

Bell

2.39%

256

80

336

76.19%

Bosque

1.19%

138

60

198

69.70%

Burnet 3.33% 272 254 526 51.71%
Coryell 2.97% 287 142 429 66.90%
Erath 0.77% 70 43 113 61.95%
Hamilton 0.59% 24 17 41 58.54%
Hays 8.10% 854 824 1,678 50.89%
Hill 2.47% 209 71 280 74.64%
Johnson 7.57% 817 372 1,189 68.71%
Lampasas 1.16% 120 98 218 55.05%
Somervell 0.48% 42 32 74 56.76%
Tarrant 0.54% 50 43 93 53.76%
Travis 68.44% 8,081 11,860 19,941 40.52%
  11,220 13,896 25,116 44.67%


There is no doubt that Travis County played an out-sized role in the vote in the Democratic Primary in CD-25, and it also provided 85.3 percent of Perri’s total vote. On the other hand, Travis County provided 72. 0 percent of Oliver’s total vote. Finally, what is the political context for the contest and the general election in November. There is little doubt that women are advantaged as candidates in 2018. There is also little doubt that a lack of political experience as an officeholder is not a deterrent to running and winning. Furthermore, in information from the candidates’ Web sites, Oliver provides a more compelling and visceral reason for seeking the office.

Is Williams vulnerable? Has his performance in office and record in past elections made his reelection in 2018 a foregone conclusion? The table indicates the votes in each county of the district in the 2014 and 2016 elections, showing the Republican incumbent (Rep I—Williams) and the Democratic challenger (Dem C—Marco Montoya in 2014 and Kathi Thomas in 2016).

2014

2016

County Rep I Dem C Rep I Dem C
Bell

781

1,543

2,581

4,897

Bosque

3,906

767

6,213

1,296

Burnet

9,182

2,144

14,772

3,697

Coryell

6,411

1,916

12,406

4,942

Erath

2,907

496

5,114

986

Hamilton

1,900

381

2,960

475

Hays

9,534

5,221

14,983

8,681

Hill

6,988

1,594

9,929

2,490

Johnson

23,390

4,882

44,495

10,575

Lampasas

3,713

745

6,410

1,436

Somervell

1,843

307

3,170

518

Tarrant

1,161

346

2,170

744

Travis

35,404

44,121

55,785

76,336

Total Votes

107,120

64,463

180,988

117,073


Is the district winnable by a Democrat in 2018? The Democratic turnout would probably have to exceed the Democratic turnout in the 2016 election, which would be difficult to achieve. A turnout of that magnitude would require an increase of more than 52,610 Democratic voters, nearly a 90 percent increase. Is that possible?

In a fund-raising email, Deputy Campaign Manager for Julie for Texas 25, Anthony Orona, stated:

Also interesting to note: the two women in the race received over 62% of the non-Travis county votes. In Travis, where Julie came in 2nd, if you add Julie’s votes to Kathi Thomas’, the two women garnered 42% of the votes in Travis County, to our opponent’s 38%. Women are leading the historic movement to take back the House – and to beat Williams in November, voters are looking for a different kind of candidate like Julie – a candidate with real expertise in areas of huge concern to the people of this district who can bring real change.

We’ve seen it over and over again – well-funded candidates who waste their money in the same old way and get unimpressive results. Julie’s campaign is different. Julie is a different kind of candidate. And our campaign is deploying our resources differently. We’re focused on comprehensive field and outreach efforts, and continuing to develop advanced digital outreach program.

According to a calculation by Ross Ramsey of the Texas Tribune, the average statewide advantage for Republican candidates was 21.9 percent in 2014 and 18.0 percent in 2016. If the better candidate is nominated in May, and the candidate can ride a Blue Wave in 2018, the Democratic candidate has a chance. I believe that the better candidate is Julie Oliver.

Here are the fund-raising totals for CD 25 for the first quarter of 2018:

TX-25 Democratic runoff Raised, Jan. 1-Feb. 14 Raised, Feb. 15-March 31 Raised, Q1 Spent, Jan. 1-Feb. 14 Spent, Feb. 15-March 31 Spent, Q1 Cash on hand, Q1
Chris Perri $17,227.18 $44,152.00 $61,379.18 $17,836.56 $54,218.65 $72,055.21 $30,603.74
Julie Oliver $23,848.37 $32,782.06 $56,630.43 $6,151.17 $21,225.27 $27,376.44 $40,860.82

Is Austin Really Liberal?

By Stefan Haag

As a result of the Austin bombings, many people have questioned whether Austin is really liberal. The questions are not new. Austin has a history of racial segregation in housing and in public education. In 2015, in a study by Richard Florida, Austin was number one among large metropolitan cities in overall economic segregation, using his seven indicators of income, educational, and occupational segregation. Also, in 2012, Austin was the last large city in Texas to adopt a single-member district electoral system for selecting the members of its city council, and then only after decades of failed attempts. As this article explains, Austin’s “gentlemen’s agreement” limited the representation of ethnic minorities on Austin’s city council to one Hispanic and one African American council member, despite the growth of Hispanics in Austin. Thus, there is sufficient evidence to question Austin’s designation as a liberal island in a sea of conservatism, or as former Governor Rick Perry said, “a blueberry in the tomato soup.”

I have chosen a different method of assessing liberalism in Austin. Given the recent primary election in March and the inclusion of ballot questions in both political parties’ primaries, it is possible to compare the support for those measures among Austin primary voters with the 1 million participants in the Democratic Party’s primary and the 1.5 million participants in the Republican Party’s primary. Admittedly, the participants in a party’s primary are not necessarily representative of all members of the party or, using both parties’ participants, of the county in which they voted. But it does provide an interesting sample to analyze.

First, I consider the eleven propositions that confronted Republican primary voters. The issues represented issues that reflect the social issues that divide the Texas Republican Party as well as several economic issues that are less divisive for Republicans. The table shows the proposition number, a brief description of the proposition, the percentage vote in Travis County, and the percentage vote statewide for the propositions:

Republican Propositions Table

In every case, the “yes” votes in Travis County are a smaller percentage than the statewide “yes” votes. The difference ranges from slightly more than one percent to 18.6 percent on the “bathroom” issue. There is no doubt that Republican primary voters in Travis County are not as conservative as the all Republican primary voters. One can suggest that the difference could be, at least partially, a result of raiding by Democrats who voted in the Republican primary in Travis County. However, such a large difference, as in the case of the “bathroom” issue and the abolition of abortion, probably is not the result of raiding. The split in the Republican Party in Texas is also evident.

The chart is visually compelling:

Republican Propositions Chart


The twelve propositions that confronted Democratic Party primary voters dealt overwhelming with rights, protected or provided by government.

Democratic Propositions Table

The “yes” votes in Travis County was a larger percentage than the statewide “yes” votes on ten of the twelve propositions. The difference on those two propositions was less than one percent. The Travis County votes were more liberal than the statewide votes on those ten propositions. Also, the Democratic Party primary participants display more unity in their votes on the propositions than Republican Party primary participants.

The chart also accentuates the differences:

Democratic Propositions Chart

Do the votes of Travis County primary voters attest to Austin’s reputation as a liberal city? If these voters represent political activists and party leaders, then Austin is indeed a liberal city.

Ballot Position and Percentage of the Vote

by Stefan Haag

In two earlier posts, I presented information on the effect of ballot position on vote choice and provided information on two multi-county contests in the 2018 Democratic Party primary election. I considered certain candidates favored because of their ballot position in certain counties. This post looks at the results in Congressional District 25, which had five candidates, and Senate District 25, which had two candidates.

In Congressional District 25, here are the percentages of the vote for each candidate by ballot position. If ballot position is important, then the candidate should have received a higher percentage of the vote when he or she was in ballot position one than when he or she was in ballot position two. As ballot position moved lower on the ballot, the percentage of the vote should have decreased. However, that wasn’t necessarily the case. The tables indicate the counties, the candidate’s ballot position, and the voting results for each candidate in the CD 25 contest:

Kathi Thomas
County Ballot Position Votes Total Votes Percentage
Bell 1 245 681 35.98%
Bosque 4 63 368 17.12%
Burnet 3 326 1,031 31.62%
Coryell 2 256 861 29.73%
Erath 1 69 209 33.01%
Hamilton 5 29 101 28.71%
Hays 3 1,452 3,800 38.21%
Hill 2 139 565 24.60%
Johnson 2 791 2,522 31.36%
Lampasas 4 78 380 20.53%
Somervell 5 22 126 17.46%
Tarrant 3 54 173 31.21%
Travis 1 5,452 31,589 17.26%
8,976 42,406 21.17%


Julie Oliver
County Ballot Position Votes Total Votes Percentage
Bell 2 256 681 37.59%
Bosque 2 138 368 37.50%
Burnet 4 272 1,031 26.38%
Coryell 1 287 861 33.33%
Erath 2 70 209 33.49%
Hamilton 2 24 101 23.76%
Hays 5 854 3,800 22.47%
Hill 1 209 565 36.99%
Johnson 3 817 2,522 32.39%
Lampasas 3 120 380 31.58%
Somervell 2 42 126 33.33%
Tarrant 4 50 173 28.90%
Travis 5 8,081 31,589 25.58%
11,220 42,406 26.46%


Chris Perri
County Ballot Position Votes Total Votes Percentage
Bell 4 80 681 11.75%
Bosque 5 60 368 16.30%
Burnet 1 254 1,031 24.64%
Coryell 5 142 861 16.49%
Erath 4 43 209 20.57%
Hamilton 3 17 101 16.83%
Hays 2 824 3,800 21.68%
Hill 4 71 565 12.57%
Johnson 4 372 2,522 14.75%
Lampasas 5 98 380 25.79%
Somervell 1 32 126 25.40%
Tarrant 2 43 173 24.86%
Travis 4 11,860 31,589 37.54%
13,896 42,406 32.77%


West Hansen
County Ballot Position Votes Total Votes Percentage
Bell 3 51 681 7.49%
Bosque 3 69 368 18.75%
Burnet 5 134 1,031 13.00%
Coryell 4 86 861 9.99%
Erath 3 22 209 10.53%
Hamilton 4 26 101 25.74%
Hays 1 518 3,800 13.63%
Hill 3 120 565 21.24%
Johnson 1 397 2,522 15.74%
Lampasas 2 43 380 11.32%
Somervell 4 26 126 20.63%
Tarrant 5 10 173 5.78%
Travis 3 2,977 31,589 9.42%
4,479 42,406 10.56%


Chetan Panda
County Ballot Position Votes Total Votes Percentage
Bell 5 49 681 7.20%
Bosque 1 38 368 10.33%
Burnet 2 45 1,031 4.36%
Coryell 3 90 861 10.45%
Erath 5 5 209 2.39%
Hamilton 1 5 101 4.95%
Hays 4 152 3,800 4.00%
Hill 5 26 565 4.60%
Johnson 5 145 2,522 5.75%
Lampasas 1 41 380 10.79%
Somervell 3 4 126 3.17%
Tarrant 1 16 173 9.25%
Travis 5 3,219 31,589 10.19%
3,835 42,406 9.04%


The following tables indicate the percentage of the vote for each candidate by ballot position:

Name Position % Vote Name Position % Vote
Panda 1 9.78% Perri 1 24.72%
2 4.36% 2 21.82%
3 9.52% 3 17.65%
4 4.00% 4 34.94%
5 9.69% 5 21.12%
Name Position % Vote Name Position % Vote
Hansen 1 14.47% Thomas 1 17.75%
2 11.32% 2 30.04%
3 14.37% 3 36.61%
4 12.68% 4 18.85%
5 11.96% 5 22.47%
Name Position % Vote
Oliver 1 34.78%
2 35.69%
3 32.29%
4 26.74%
5 25.25%


The non-linear characteristic of the relationship indicates that ballot position did not have a pronounced effect on the percentage of vote received by the candidate. The charts demonstrate this characteristic more dramatically:

Ballot Position_1

Ballot Position_2

Ballot Position_3

Ballot Position_4

Ballot Position_5

Of the five candidates, only Julie Oliver’s votes somewhat demonstrated the expected effect of ballot position, and even she got the highest percentage of the vote when she was second on the ballot rather than first, as expected.

These results indicate that there are many factors that affect a candidate’s percentage of the vote, and ballot position is only one of those factors. I have no data on campaign activities by the candidates in the 13 counties that make up the district, which inhibits any ability to control for their effects.

In the two candidate race in SD 25, the ballot position effects were opposite of what one would expect for both candidates. The charts demonstrates that both Kling and Guerra did better when in position 2 on the ballot:

Ballot Position_6

Ballot Position_7


The percentage differences between first and second position on the ballot were not large, but there were differences. Obviously, in a two-person contest, voters are more likely to know which candidate they support, making ballot position less important.

These results suggest that ballot position does have an effect of voting percentage; however, there are many variables that must be controlled in order to ascertain, with any certainty, the isolated effect that ballot position has on a candidate’s percentage of the vote. More studies are needed.

A Tsunami, a Wave, or a Ripple?

By Stefan Haag

The results of early voting in Texas’ 15 counties with the largest number of registered voters gave Democrats hope for a tsunami of votes when the votes were counted after Election Day. The graph compares the Republican and Democratic early vote in those 15 counties in 2014, 2016, and 2018. The reason for Democratic exuberance is obvious.

Early Voting, Primary Elections, 2014-2018

Democratic primary voters constituted 4.69 percent of registered voters (RV), and Republican primary voters were 4.24 percent of RV. The difference was 44, 916 votes.

In the daily totals in the 15 counties, Democrats also surpassed Republicans during early voting on most days. This added to the anticipation of a major Democratic wave.

Daily Turnout Early Vote 2018

However, when the final count of early votes and Election Day votes was tallied, Democratic ebullience was replaced by consternation. Once again, Republican voters were more numerous than Democratic voters: 1,543,725 votes were accumulated for Republicans, and 1,037,799 votes were counted for Democrats. The early vote lead established by Democrats in the 15 largest counties’ early vote was eliminated when all early votes were counted. Although the 15 counties contain 65 percent of registered voters in the state, the early vote for Democrats in those counties constituted 82.29 percent of the total early votes by Democrats. On the other hand, those 15 counties’ votes were only 52.24 percent of total early votes by Republicans. The 44,916 vote advantage became a 239,226 deficit when all the early votes were posted.

The pundits were critical of the results and the expectations created by Democrats for a larger turnout than Republicans. Some attempted to extrapolate from the primary vote to the general election, predicting that few, in any, gains would be made by Democrats in the November general election. Others, however, noted that primary election turnout is not a good predictor of general election turnout, and that the only take away is the enthusiasm of a political party’s voters. By that measure, Democrats and Republicans were successful—the Democrats during early voting, and Republicans on Election Day.

In Travis County, voter turnout favored the Democrats by nearly three-to-one. There were 114,058 Democratic votes, a turnout of 15.54 percent of the county’s registered voters. On the Republican side, there were 40,636 Republican votes, a turnout of 5.54 percent of the county’s registered voters. There was little difference in the percentage of the total primary vote that was cast during early voting between the political parties’ members—54.72 percent of Democratic votes were early votes, and 53.33 percent of Republican votes were cast during early voting.

In Southwest Austin, a group of Democrats—mostly women—committed to increasing voter turnout in the Democratic primary decided to use traditional voter turnout tactics of block walking, postcards, and phone banks in 17 precincts. The group is the Blue Action Democrats (BAD). How successful were they?

The results were rather dramatic, especially when compared with the 2014 primary election. Fourteen of the 17 precincts exceeded the turnout for Travis County. Several of the precincts even approached the turnout in the Democratic primary in 2016. The graph depicts the turnout rates in those precincts in the 2014, 2016, and 2018 primary elections.

BAD Precincts 2014-2018 Voter Turnout

So, did Democratic primary voters create a tsunami, wave, or ripple? A conservative analysis would be that Texas Democrats came alive in 2018, given their moribund state in 2014. The life witnessed in March will need to be nurtured to turn Texas from a “Red State” to a purple state, but groups such as Blue Action Democrats provide a blueprint for change. Combining old-fashioned block walking, phone banking, and postcard notices with social media—a Facebook page for members, email, and texts—creates the necessary condition for a substantial increase in voter turnout.

The Legislative Primaries Have Come—but they are not yet Gone

By Gary A. Keith

The primary elections are over—or are they?

My colleague Stefan Haag is following up his earlier posts on the issue of voter turnout. Here, I follow up on my earlier post about the state legislative races in the Austin area—with some comments at the end about interesting outcomes outside the Republic of Austin as well. And finally, I want you to stay tuned for an upcoming blog post on the disaster known as run-off primary elections.

If you would like to be involved with any of the active campaigns (May 22 runoff or November 6 general election) the contact information is provided here for each candidate.

Texas Senate

Travis County is divided into four Senate districts: 14th, 21st, 24th, and 25th. Senate terms are four years, so only two of those districts are up for election in 2018: the 14th (currently held by Democrat Kirk Watson) and the 25th (currently held by Republican Donna Campbell). Both incumbent senators are running for re-election.

On the Democratic side, Senator Watson ran unopposed in District 14:

Kirk Watson Democratic P.O. Box 2004, Austin, TX 78768 www.kirkwatson.com

On the Republican side in District 14, George Hindman ran unopposed and will be on the November ballot against Sen. Watson:

George W. Hindman Republican P.O. Box 143881 Austin, TX 78714 www.votehindman.com

In District 25 incumbent Senator Donna Campbell faced Republican challenger Shannon McClendon and prevailed easily with 74% of the vote:

Donna Campbell Republican P.O. Box 171002, San Antonio, TX 78217 http://www.donnacampbell.com

In District 25, two candidates vied for the Democratic nomination to challenge Sen. Campbell. In an extremely close race, if the totals hold up, Steven Kling, with 51%, will be on the November ballot facing Sen. Campbell. Kling is from Dripping Springs and is a Bernie Sanders Democrat.

Steven Kling Democratic P.O. Box 1541, Dripping Springs, TX 78620 www.klingtx25.org


Texas House of Representatives

Travis County is divided into six House districts: 46th, 47th, 48th, 49th, 50th, and 51st.

First, the Republican primaries. There is currently one Republican incumbent in Travis County: Paul Workman, in District 47. Workman is running for re-election and had two Republican opponents in the primary. He won with 59% of the vote:

Paul D. Workman Republican P.O. Box 340210, Austin, TX 78738 www.Workmanfortexas.com

In District 46, one candidate ran and won the Republican nomination:

Gabriel Nila Republican 19332 James Manor St., Manor, TX 78653 www.gabrielnila.com

In District 49, one candidate ran and won the Republican nomination:

Kyle Austin Republican 10926 Jollyville Rd., Austin, TX 78759  

No Republicans filed for Districts 48, 50, or 51.

For the Democrats, the hot race was in District 46. After a plethora of issues covered by the media, longtime Representative Dawnna Dukes drew five challengers—and she won only 10% of the vote in her bid for another term, not even making the runoff. This seat has been the only Travis County legislative seat to be won by an African American, as it encompasses much of the African American population in the county. Wilhelmina Delco represented the district for 20 years, and Dukes for the last two decades. The top two candidates now heading into the May 22 runoff for the seat are former Austin City Council member and Mayor Pro-Tem Sheryl Cole, who is African American, and Jose “Chito” Vela, who is an immigration attorney, a former Planning Commission member, and a Bernie Sanders Democrat. Recall that there is a Republican nominee in this district (Gabriel Nila), so there will be a general election race after the Democratic runoff:

Sheryl Cole Democratic 4101 Wildwood, Austin, TX 78722 www.sherylcole.com
Jose “Chito” Vela Democratic 1407 Ridgemont Dr., Austin, TX 78723 http://www.chitovela.com

In District 47, five Democratic candidates competed for the nomination in this, the only seat currently held by a Republican (Paul Workman). Vikki Goodwin led the field with 33.6% of the vote, followed by Elaina Fowler with 29.2%. Thus, these two women will face each other in the May 22 runoff to see who challenges Workman. If November proves to be a year of gains for women, and Democrats, Workman could be in trouble.

Elaina Fowler Democratic P.O. Box 161752, Austin, TX 78746 https://www.fowlerfortexas.com
Vikki Goodwin Democratic 9901 Brodie Ln., Ste 160-237, Austin, TX 78739 www.votevikki.com

In District 49, Representative Gina Hinojosa ran unopposed; recall, though, that there is a Republican nominee for this seat (Kyle Austin), so there will be a November race:

Gina Hinojosa Democratic P.O. Box 300095, Austin, TX 78703 www.ginaforaustin.com

In District 48, Representative Donna Howard ran unopposed; in District 50, Representative Celia Israel ran unopposed; and in District 51, Representative Eddie Rodriguez ran unopposed. No Republicans are running in those three seats, so the Democratic incumbents will not face November races.

All the victorious candidates in November will then be sworn in as members of the 86th Legislature when it convenes January 8th. Thus, their experiences and successes will be tied in with all 181 legislators. Most incumbents won their nominations and will win the November election to return. But we are likely to see a larger turnover than usual—starting with some surprising results and runoffs from the primaries.

One incumbent senator was defeated: Republican Craig Estes (Wichita Falls). Six incumbent state representatives were defeated outright: Democrats Roberto Alonzo (Dallas), Diana Arevalo (San Antonio), Tomas Uresti (San Antonio), and Austin’s Dawnna Dukes. Republicans defeated were Wayne Faircloth (Galveston) and Jason Villalba (Dallas). One additional Democratic incumbent was forced into a runoff—longtime Representative Rene Oliveira (Brownsville). Moreover, counting open seats, there will be at least 15 legislative runoffs (and several congressional seat runoffs) around the state, so the drama is not over.

The names and the parties that you see here are real people and actual political parties—but to understand them as more than that, you need to see the forest. And the forest of 181 trees that is the Texas Legislature is shaped by two non-members, Governor Greg Abbott and Lt. Governor Dan Patrick, and one particular political action committee—Empower Texans (a Tea-Party like group). Patrick (and Empower Texans) was successful in taking out his own party’s incumbent Craig Estes, in an effort to get a Senate membership even more loyal to tea party Republicanism. Abbott weighed in on three Republican House races. He lost two of those. Most notably, he reportedly spent a quarter of a million dollars in an attempt to defeat fellow Republican, State Representative Sarah Davis. She won anyway. She is arguably the center of the House—the most moderate Republican (though still to the right of any Democrat). Thus, Abbott and Patrick are seeking not only a Republican majority, but a more conservative majority, and thus a more polarized session.

With those and other victories by the tea party wing of the Republican Party—and the potential for a national (and Texas) wave election in favor of Democrats and women candidates, the question is how many of those more extreme Republican candidates will now be vulnerable to defeat by Democrats in November—particularly in marginal districts.

Stay tuned! And come back for an analysis of what is wrong with run-off elections.

Bottom of the Barrel

By Stefan Haag

What’s the last item on the Republican Party’s ballot and on the Democratic Party’s Ballot? A list of propositions. Primary voters are asked their position on a number of propositions (Democrats have 12, and Republicans have 11). The propositions are an attempt to gauge the parties primary voters’ views on issues that are salient to the party.

The propositions raise several questions for me, and you probably can think of some more. Here are mine: Are the issues considered salient for the Democratic Party different from those that are salient for the Republican Party? Is not only the content but also the syntax different in the parties’ propositions? Are the propositions worded in such a way that a particular response is likely to be elicited? Do you feel as if you’re being used by the party to confirm what it wants you to believe? Are these questions useful to you? Will the responses to these propositions affect each party’s platform in 2018? Will most voters ignore them, causing a significant ballot drop off?

Here are the Republican Propositions:

REPUBLICAN PRIMARY BALLOT PROPOSITIONS

Republican Proposition 1

Texas should replace the property tax system with an appropriate consumption tax equivalent.

Republican Proposition 2

No governmental entity should ever construct or fund construction of toll roads without voter approval.

Republican Proposition 3

Republicans in the Texas House should select their Speaker nominee by secret ballot in a binding caucus without Democrat influence.

Republican Proposition 4

Texas should require employers to screen new hires through the free EVerify system to protect jobs for legal workers.

Republican Proposition 5

Texas families should be empowered to choose from public, private, charter, or home-school options for their children’s education, using tax credits or exemptions without government constraints or intrusion.

Republican Proposition 6

Texas should protect the privacy and safety of women and children in spaces such as bathrooms, locker rooms, and showers in all Texas schools and government buildings.

Republican Proposition 7

I believe abortion should be abolished in Texas.

Republican Proposition 8

Vote fraud should be a felony in Texas to help ensure fair elections.

Republican Proposition 9

Texas demands that Congress completely repeal Obamacare.

Republican Proposition 10

To slow the growth of property taxes, yearly revenue increases should be capped at 4%, with increases in excess of 4% requiring voter approval.

Republican Proposition 11

Tax dollars should not be used to fund the building of stadiums for professional or semi-professional sports teams.

Here are the Democratic Propositions:

DEMOCRATIC PRIMARY BALLOT PROPOSITIONS

Democratic Proposition #1 – Right to a 21st Century Public Education

Should everyone in Texas have the right to quality public education from pre-k to 12th grade, and affordable college and career training without the burden of crushing student loan debt?

Democratic Proposition #2 – Student Loan Debt

Should everyone in Texas have the right to refinance student loan debt with the Federal Reserve at a 0% interest rate, as relief for the crushing burden of debt and an investment in the next generation of Americans? 

Democratic Proposition #3 – Right to Healthcare

Should everyone in Texas have a right to healthcare, guaranteed by a universal, quality Medicare-for-all system?

Democratic Proposition #4 – Right to Economic Security

Should everyone in Texas have the right to economic security, where all workers have earned paid family and sick leave and a living wage that respects their hard work?

Democratic Proposition #5 – National Jobs Program

Should the Democratic Party promote a national jobs program, with high wage and labor standards, to replace crumbling infrastructure and rebuild hurricane damaged areas, paid for with local, state, and federal bonds financed through the Federal Reserve at low interest with long term maturities?

Democratic Proposition #6 -Right to Clean Air, Safe Water, and a Healthy Environment

Should everyone in Texas have the right to clean air, safe water, and a healthy environment?

Democratic Proposition #7 – Right to Dignity & Respect

Should everyone in Texas have the right to a life of dignity and respect, free from discrimination and harassment anywhere, including businesses and public facilities, no matter how they identify, the color of their skin, who they love, socioeconomic status, or from where they come?

Democratic Proposition #8 – Right to Housing

Should everyone in Texas have the right to Affordable and accessible housing and modern utilities including high speed internet, free from any form of discrimination?

Democratic Proposition #9 – Right to Vote

Should every eligible Texan have the right to vote, made easier by automatic voter registration, the option to vote by mail, a state election holiday, and no corporate campaign influence, foreign interference, or illegal gerrymandering?

Democratic Proposition #10 – Right to a Fair Criminal Justice System

Should everyone in Texas have the right to a fair criminal justice system that treats people equally and puts an end to the mass incarceration of young people of color for minor offenses?

Democratic Proposition #11 -Immigrant Rights

Should there be a just and fair comprehensive immigration reform solution that includes an earned path to citizenship for law-abiding immigrants and their children, keeps families together, protects DREAMers, and provides workforce solutions for businesses? 

Democratic Proposition #12 Right to Fair Taxation

Should everyone in Texas have the right to a fair tax system, where all interests (business, corporations, and individuals) pay their share, so that state government meets its obligations?


Electing Justice

By Gary A. Keith

Last week in Corpus Christi, U.S. District Judge Nelva Gonzales Ramos heard a lawsuit (Lopez v. Abbott) challenging the way Texas elects judges to the state’s two highest courts. What is this all about?

The lawsuit seems to have come from out of the blue, as it has not been on the media radar. Yet, in reality—it was filed in 2016, with roots back into legislative battles in the 1980s and 1990s and deep into civil rights battles and changing population demographics in the state.

Quirky Texas (and Oklahoma) has two state supreme courts—not one. The Texas Supreme Court, with nine justices, hears civil cases only. The Texas Court of Criminal Appeals, with nine judges, is the state’s top court for criminal cases. All eighteen judges are elected statewide. Plaintiffs in Lopez v. Abbott argue that “The at-large method of electing judges to the two high courts submerges Latino voters so that they are rendered ineffective minorities in most every election for both courts.” And they point out that both courts render decisions with major impacts on Latinos.

Let’s step back and see the roots of the case. Latinos and African-Americans finally started gaining representation in the Texas legislature in the 1970s with the change to single-member districts. But as Texas courts remained virtually all white (Anglo), the new minority legislators and their allies pushed efforts to diversify the judiciary as well. State district judges have to run countywide, even if there are multiple judges, as there are in urban areas. State appeals court judges run from multi-county districts. And the top two courts’ judges run statewide. Thus, with race-based voting patterns, for much of Texas history, the Anglo majority in counties, in districts, and statewide, has been able to elect 100%, or nearly 100%, of the state’s judges. In the 1980s, minority legislators filed bills to break some counties and some appellate regions into voting districts. For example, if Houston (Harris County) has ten state district judges, instead of all of them running countywide, there could be ten separate electoral districts, and a judicial candidate would run in one district—just as happens with legislators. With residential housing patterns, it is likely that Latino communities and African American communities could become the majority in a few of the districts, and thus have a greater potential to elect minority judges. The bills failed.

So, in 1988 the League of United Latin American Citizens (LULAC) and others filed a federal lawsuit against Governor Bill Clements, arguing that the state’s judicial selection method violates equal protection requirements of the U.S. Constitution as well as Section 2 of the U.S. Voting Rights Act (VRA). But in 1993, the U.S. Fifth Circuit Court ruled on appeal that the at-large election system for district court judges does NOT constitute a Voting Rights Act violation. The U.S. Supreme Court declined to hear LULAC v. Clements.

The Fifth Circuit ruled that evidence of minority vote dilution could be explained by partisan affiliation, and thus was not covered by the VRA. The court ruled that there is a legitimate state interest in linking at-large electoral and jurisdictional bases. That is, a district judge can hear any legitimate case filed in Harris County, not just from a particular geographical section of the county. So, it is rational for the state to have a system of countywide election of those judges.

Efforts to change the system continued in the legislature. Minority legislators and their allies blocked the creation of new courts, trying to pressure changes in the judicial selection system. In 1995, the Senate passed a constitutional amendment proposal to create a mixed judicial electoral system, with subdistricts for some courts. The House killed the proposal. The legislature then set up a Judicial Selection Task Force to study the issue. (See House Research Organization Session Focus “Judicial Selection: Options for Choosing Judges in Texas,” March 10, 1997.)

And here we are, more than twenty years later, still studying it, still debating whether or how to address the reality of a population that is so multi-cultural that Anglos are no longer the majority—yet the judiciary remains overwhelmingly Anglo. In Lopez v. Abbott, the plaintiffs’ brief points out that Latinos make up 37.6% of the Texas population now (26.5% of the citizen voting age population). Yet since 1945, 90% of Supreme Court justices and 92% of Court of Criminal Appeals judges have been white. In the modern era, since 2002, there have been only three Latino judges on the Supreme Court, one on the Court of Criminal Appeals—and those were choices of governors, not of the Latino community (indeed, Republican voters defeated the governors’ Latino choice).

So, with legislative efforts stymied, proponents are again turning to the federal courts. Thirteen lawyers are representing plaintiffs in the Lopez case. The Lawyers’ Committee for Civil Rights under Law (based in Washington, D.C.) as well as New York lawyers plus a contingent of Texas lawyers filed the case in 2016. The lead attorney is San Antonio voting rights lawyer Jose Garza, who has been a leading lawyer on redistricting cases against local governments as well as the state.

The 1993 LULAC decision from the Fifth Circuit is a major hurdle for the plaintiffs to overcome. Plaintiffs argue, though, that demographics and the electoral history of Texas mean that the state meets the Thornburg test (Thornburg v. Gingles, 1986): the Latino community is compact (in some areas of the state), is politically cohesive, and the majority Anglo community often bloc votes to defeat the minority community’s choices.

Plaintiffs filed the suit in 2016 before Judge Ramos and both sides agreed to a bench trial (no jury). In 2017, she ruled in a separate case that the new Texas voter identification law intentionally discriminates against Latinos—which does not bode well for the state in this Lopez case. In its responses to the suit, Attorney General Paxton’s office filed a motion urging the judge to throw out the case because there is no jurisdiction under the Voting Rights Act. She rejected their motion. The state filed a motion arguing that plaintiffs lacked a standing to sue. She rejected their motion. The state filed a motion to exclude plaintiffs’ expert testimony. She rejected their motion. Thus, after two years of trying unsuccessfully to get rid of the suit, the state now is in trial defending its judicial selection system.

Texas will surely offer up the LULAC case as dispositive—and the judge may agree. On the other hand, if she rules in favor of the plaintiffs, then what? Plaintiffs argue for a system of nine districts for the Supreme Court and nine for the Court of Appeals. That is a bit bizarre, as it means the Chief Justice and Chief Judge would be elected just from one district—or perhaps the nine would then select the Chief internally. Alternatively, the plaintiffs suggest eight districts, plus one statewide Chief, per Court. Then, of coure, if this wall is breached at the top court level, the pressure will intensify for the legislature to again address the issue at the district court and appellate court levels.

And so, we await the decision from Her Honor, and then the inevitable appeals. What would have REALLY been interesting is if the plaintiffs had filed the federal lawsuit in San Antonio and had gotten it before U.S. District Judge Xavier Rodriguez. Judge Rodriguez is a Republican who was appointed to the Texas Supreme Court by Governor George W. Bush—then defeated by an Anglo candidate in the Republican primary. Soon, President George W. Bush appointed him to the federal bench. But perhaps he couldn’t have taken the case, as he is extremely busy as one of three judges on the panel that has ruled that the state’s Congressional and legislative redistricting efforts are illegal racial gerrymanders.